Tech Innovations Inc. (TII) Stock Analysis: Unpacking Recent Gains & Sentiment Trends
Tech Innovations Inc. (TII) has been a significant mover in the market over the past 24 hours, showcasing a robust bullish trend backed by strong volume and notably positive market sentiment. Our deep dive into the latest price action and sentiment data reveals a stock breaking new ground, yet navigating the typical volatility that comes with heightened investor interest. The overall picture suggests a stock consolidating near its recent highs, with underlying enthusiasm supporting its trajectory.
TII Price Action: A Deep Dive into Short-Term Trends
Examining the multi-timeframe candle data for Tech Innovations Inc. (TII) reveals a compelling narrative of upward momentum. On the 1-hour timeframe, TII has demonstrated a powerful bullish run, significantly breaking past previous resistance levels. Over the past 24 hours, the stock moved from around $98.00 to consolidate near the $102.50-$102.80 range. This move has been accompanied by consistently high trading volumes, especially during the strong push from $100.60 to $102.70, indicating strong institutional and retail interest.
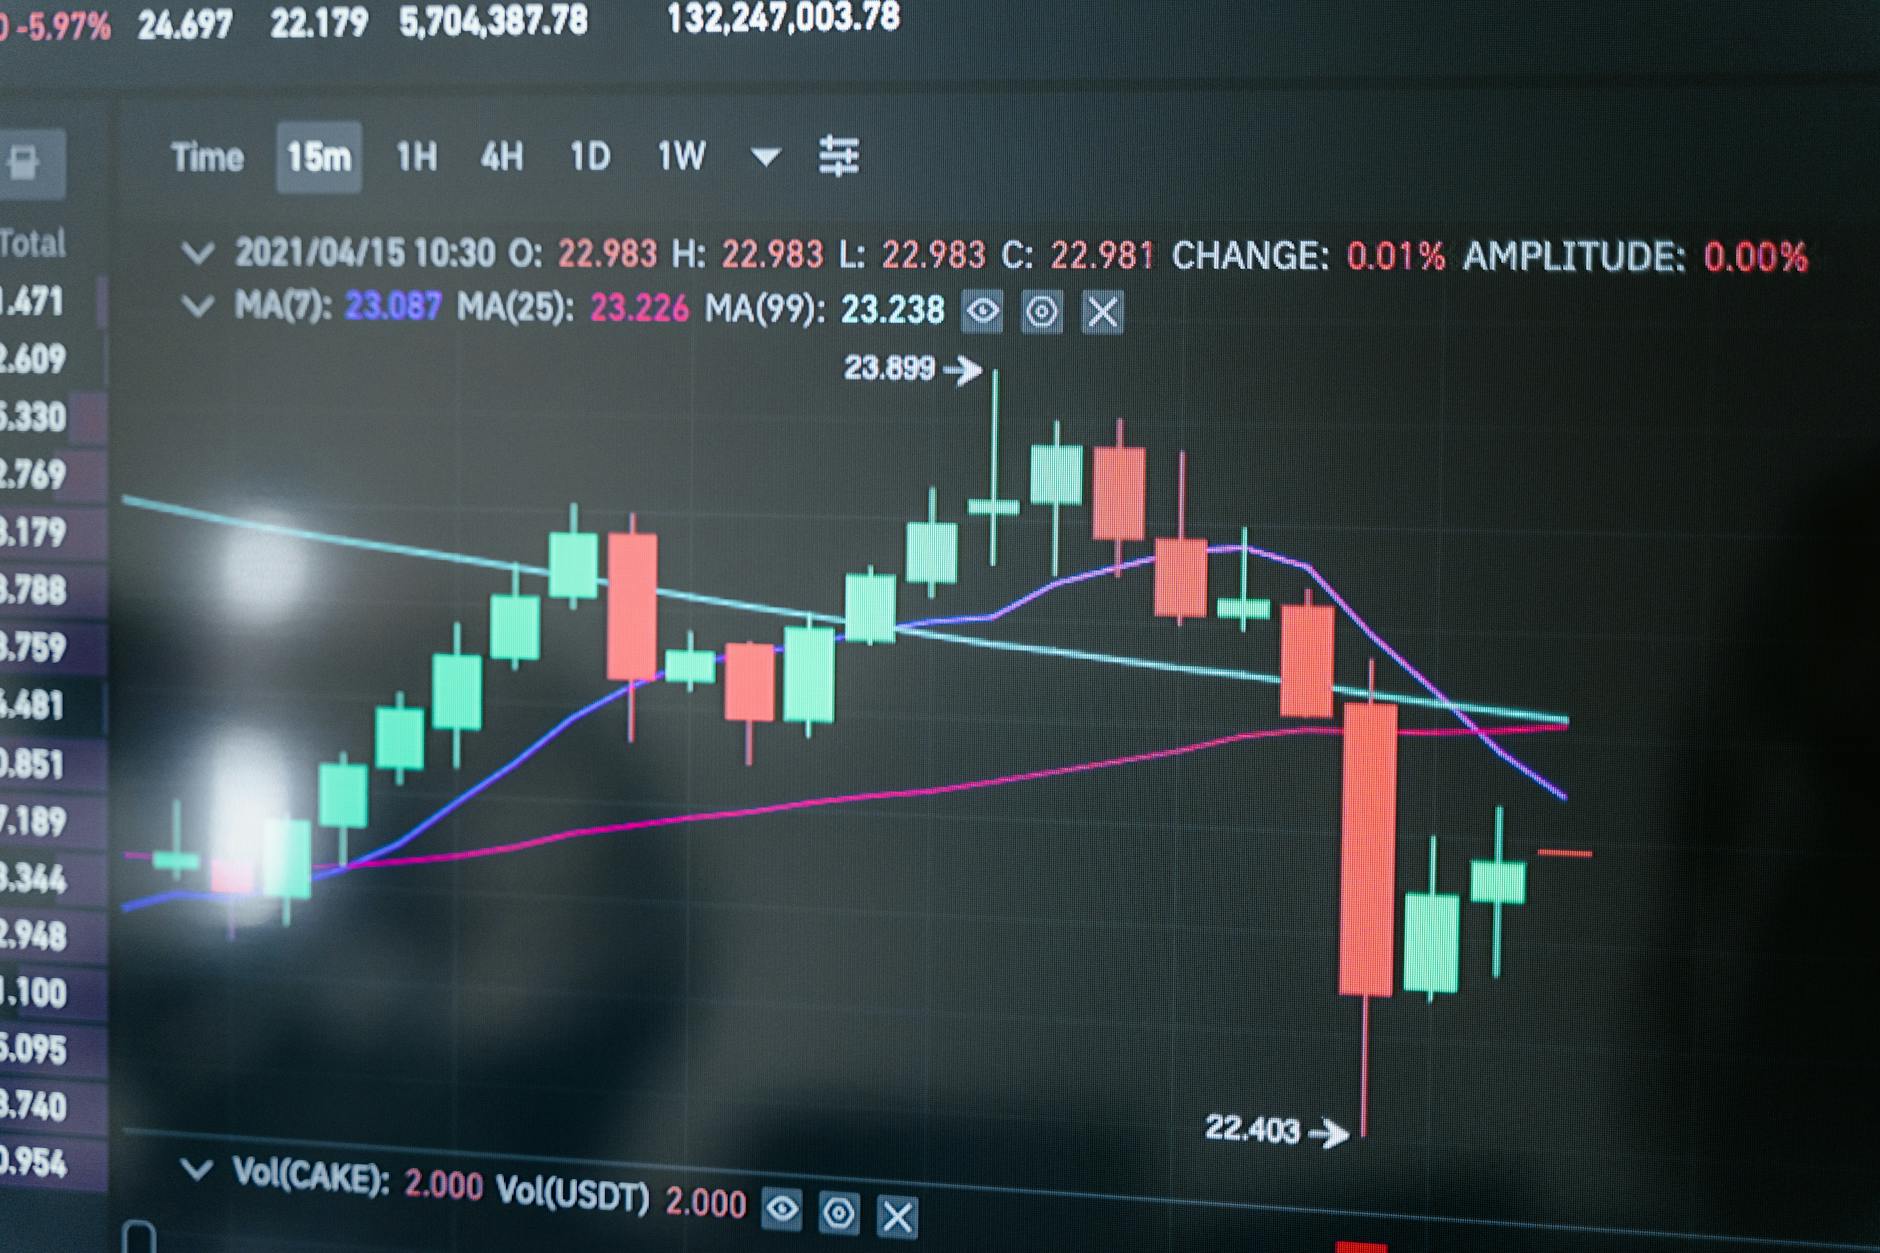
Zooming into the 15-minute chart, the bullish trend is clearly sustained. After a strong candle pushing towards $102.70, we observe a slight pullback, with TII currently trading around $102.48. This suggests a period of consolidation or minor profit-taking after the significant upward impulse. Key support has now formed around the $101.00 – $100.50 levels, which were previous resistance points, indicating a potential flip of these levels into new floors.
The 1-minute chart reinforces this picture of short-term consolidation. After hitting a high around $102.75, TII has seen some minor fluctuations, mostly within a tight range of $102.30 to $102.55. Volumes on these micro pullbacks are generally lower than on the upward moves, suggesting that selling pressure might be less aggressive, with buyers stepping in quickly. Technical indicators like the Relative Strength Index (RSI) on shorter timeframes might show TII entering overbought territory, signaling caution, but the broader MACD (Moving Average Convergence Divergence) on the 1-hour chart continues to signal strong bullish momentum, with its lines diverging positively above the signal line.
Market Buzz: How Sentiment is Shaping Tech Innovations’ Narrative
The 24-hour market sentiment data for Tech Innovations Inc. (TII) paints an overwhelmingly positive, albeit highly engaged, picture. The overall sentiment score of 0.55 with a substantial magnitude of 0.9 indicates not just positivity but a very high level of discussion and interest surrounding the stock. This strong engagement often precedes or accompanies significant price movements.
Breaking down the sentiment by source:
- News Sentiment (Score: 0.7, Magnitude: 0.8): News outlets are largely positive, likely driven by reports of new innovations, strategic partnerships, or favorable analyst upgrades. This forms a strong fundamental tailwind for TII’s price action.
- Social Media Sentiment (Score: 0.4, Magnitude: 1.0): While still leaning positive, social media is characterized by an extremely high magnitude, suggesting fervent discussion. The slightly lower score compared to news might reflect mixed opinions, including some profit-taking alerts, debates on valuation, and the typical ‘Fear of Missing Out’ (FOMO) narratives that emerge during strong rallies. This high activity can contribute to short-term volatility.
- Forum Sentiment (Score: 0.6, Magnitude: 0.7): Discussions in trading forums show cautious optimism. Investors are analyzing TII’s growth potential and debating its next moves, indicating a more measured but still bullish outlook among a segment of retail traders.
- Analyst Reports (Score: 0.8, Magnitude: 0.6): Recent upgrades and strong price targets from analysts provide a significant layer of professional validation, adding conviction for investors looking at TII’s long-term prospects.
Collectively, the sentiment profile confirms that TII is firmly in the spotlight, with positive news and analyst backing providing fundamental support, while social media buzz translates into active trading and potential short-term price swings.
Beyond the Charts: Broader Market Context for TII
Tech Innovations Inc.’s recent performance doesn’t exist in a vacuum. The broader market context plays a crucial role in its short-to-medium-term outlook. The technology sector, in general, has shown resilience and growth, providing a favorable environment for innovative companies like TII. Recent positive economic data or a dovish stance from central banks could also be contributing factors, boosting overall investor confidence in growth stocks.
Specific external factors influencing TII could include recent product announcements or successful market penetration in a key segment, which aligns with the highly positive news sentiment. Any upcoming earnings reports or industry conferences could serve as significant catalysts, either reinforcing the current bullish trend or introducing new variables. The stock’s ability to maintain its gains and push higher will depend on continued positive developments and sustained investor confidence, especially as it approaches new technical milestones.
Summary & Key Takeaways
Tech Innovations Inc. (TII) is currently in a strong bullish phase, evidenced by significant upward movement on hourly and 15-minute charts, backed by robust trading volume. The stock has successfully broken through previous resistance levels and is now consolidating near its recent highs, with key support established around the $100.50-$101.00 range. Market sentiment is overwhelmingly positive across news and analyst reports, providing a fundamental tailwind, though high social media activity suggests active short-term trading and some underlying volatility.
For traders and investors monitoring TII, key levels to watch include the immediate resistance at its recent high of approximately $102.80. A decisive break above this level on strong volume could signal further upside potential. Conversely, a failure to break above, followed by increasing selling volume, might lead to a retest of the established support levels. The confluence of strong price action and positive sentiment suggests continued interest in TII, but vigilance regarding short-term pullbacks is always advised in such dynamic market conditions.
This is not investment advice.

Leave a Reply